
Extract Information
In this page, we discuss how to extract the information from the sensors.
Access the Grafana Dashboard: To extract data from the Grafana dashboard, the user needs first to access the dashboard. This can typically be done by logging in to the dashboard tab.
Credentials are the same as the ones used for logging into the platform.
-
Select Panel: Once the user has accessed the Grafana dashboard, they need to select the panel from which they want to extract data. The panels are the individual visualizations that display data on the dashboard.
-
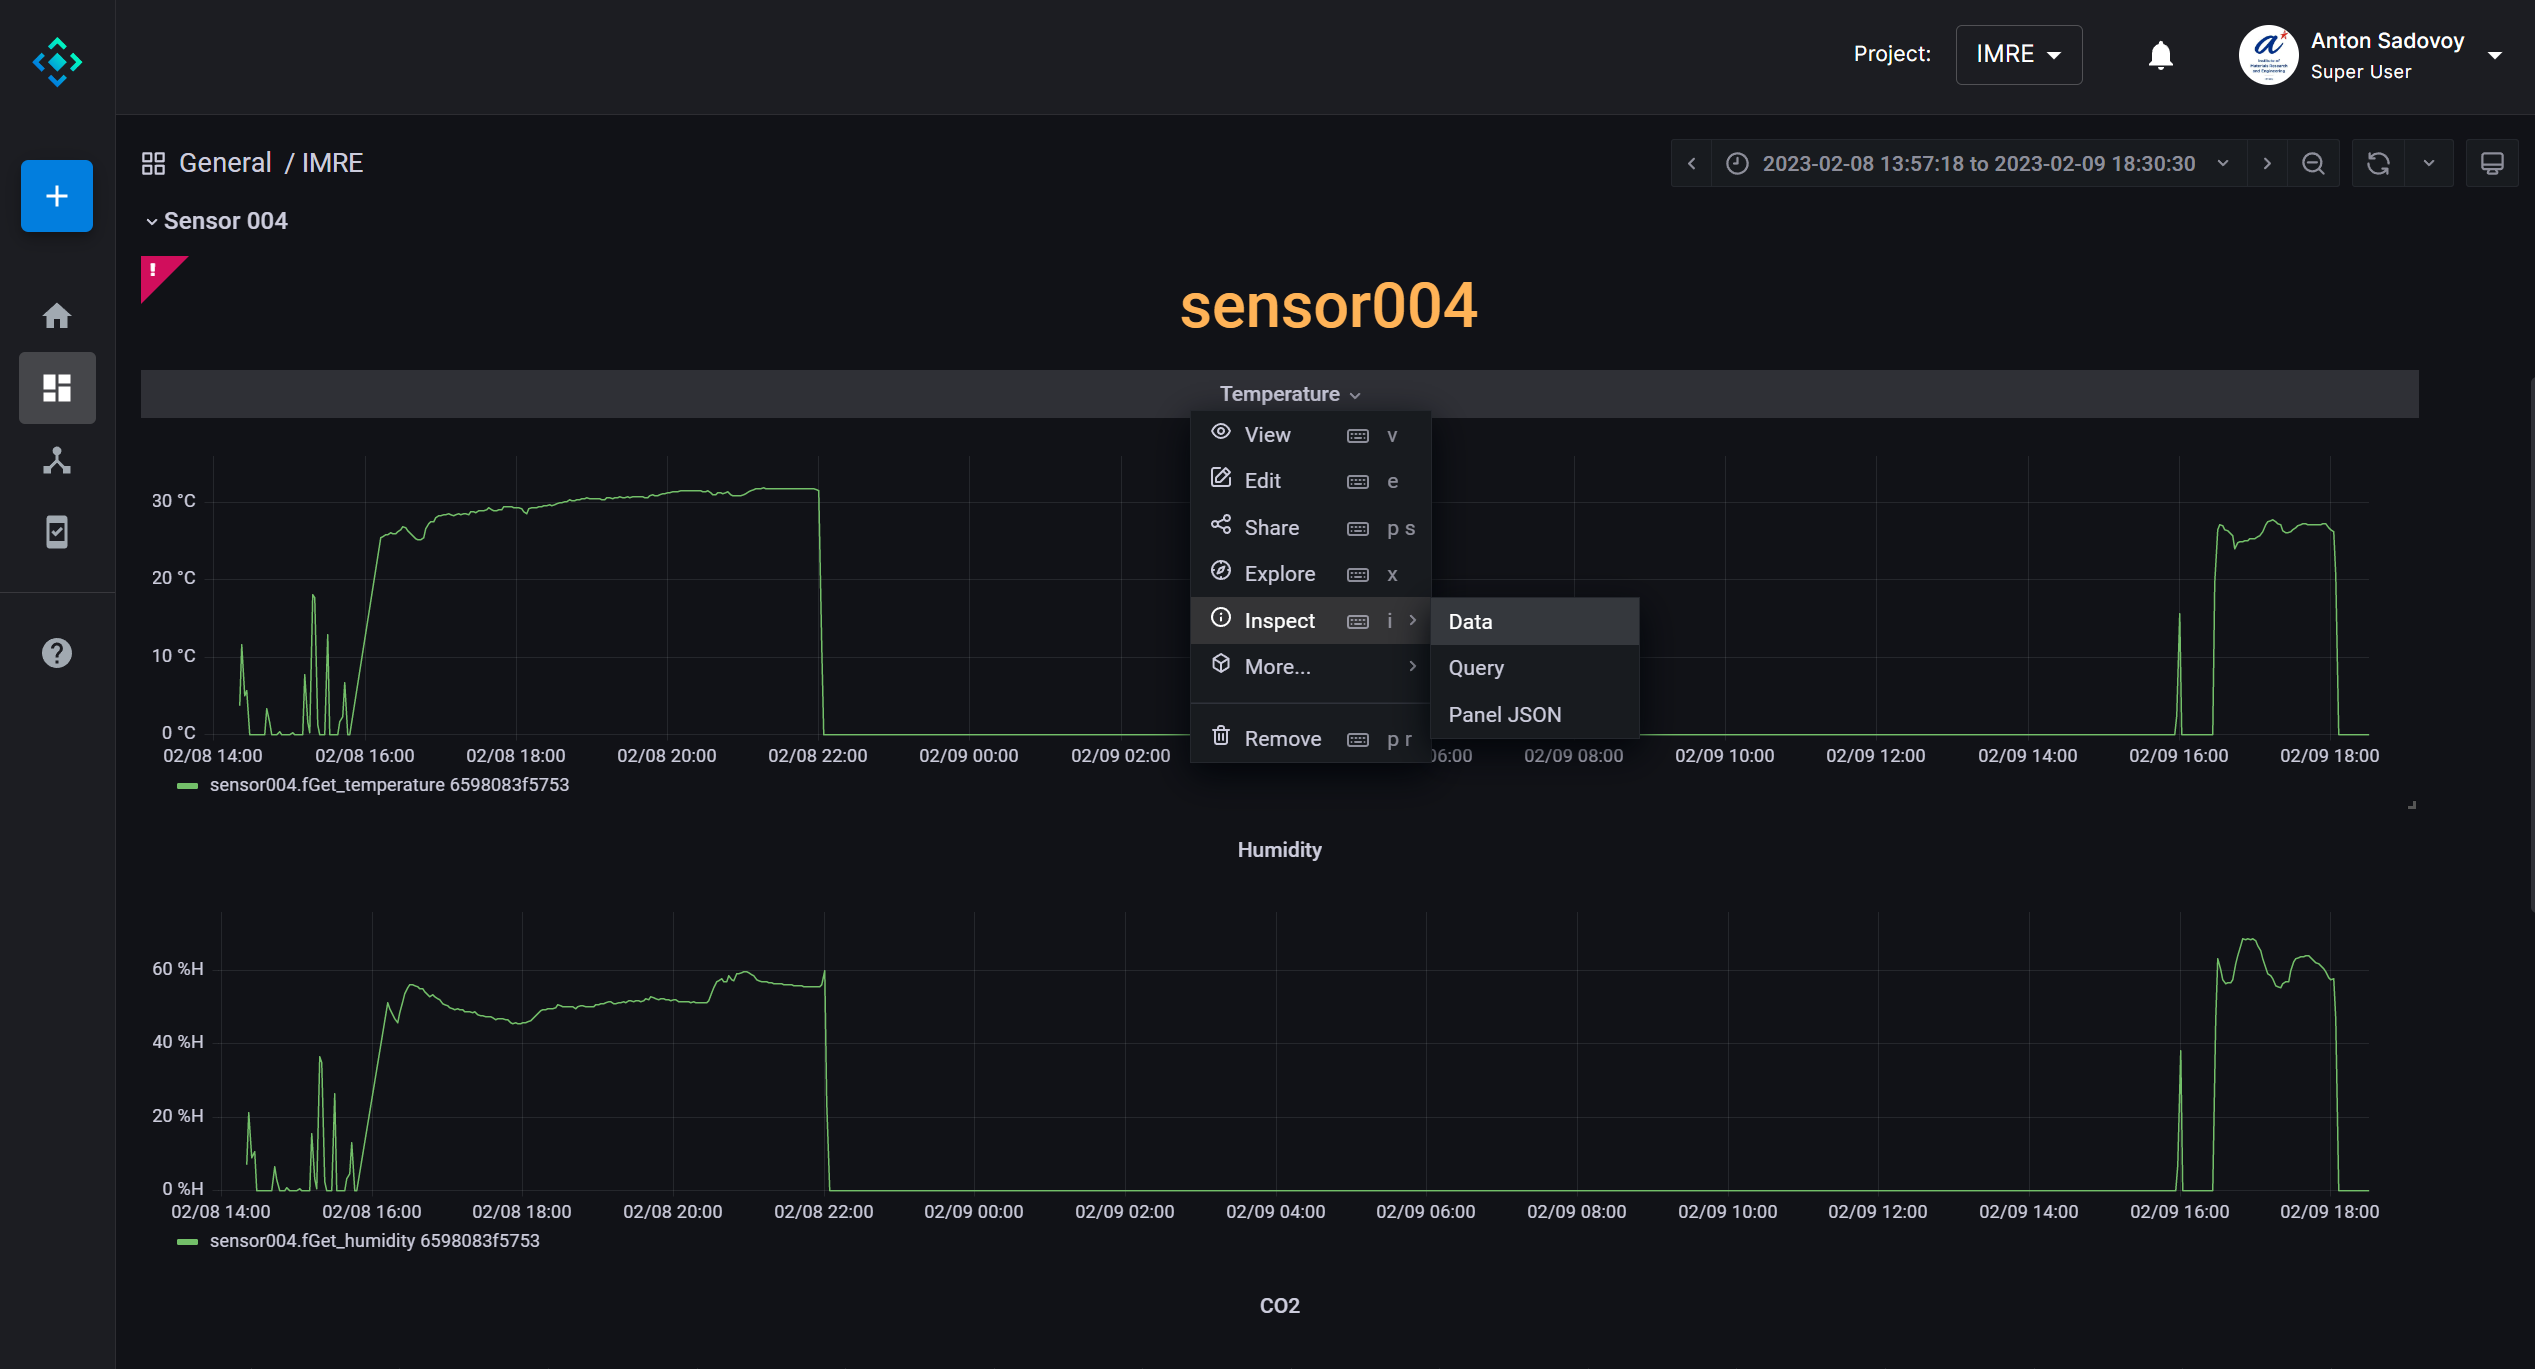
Click on Dropdown: After selecting the panel, the user should look for the "Edit" button. This button is usually located in the top center of the panel. Clicking on the dropdown arrow will allow the user to access the panel's configuration options.
-
Click on Inspect: The user should look for the "Inspect" option within the panel configuration options, which is often located in a drop-down menu or submenu. Clicking on "Inspect" will open up a new window. The user should look for the "Data" option on the new page. Clicking on this option will reveal a range of data-related features and tools.
Dashboard Panels
- Download CSV: To extract the data, the user needs to look for the "Download CSV" option. This is typically a button or link that can be found on the "Data" page. Clicking on "Download CSV" will prompt the platform or application to generate a CSV file of the relevant data.
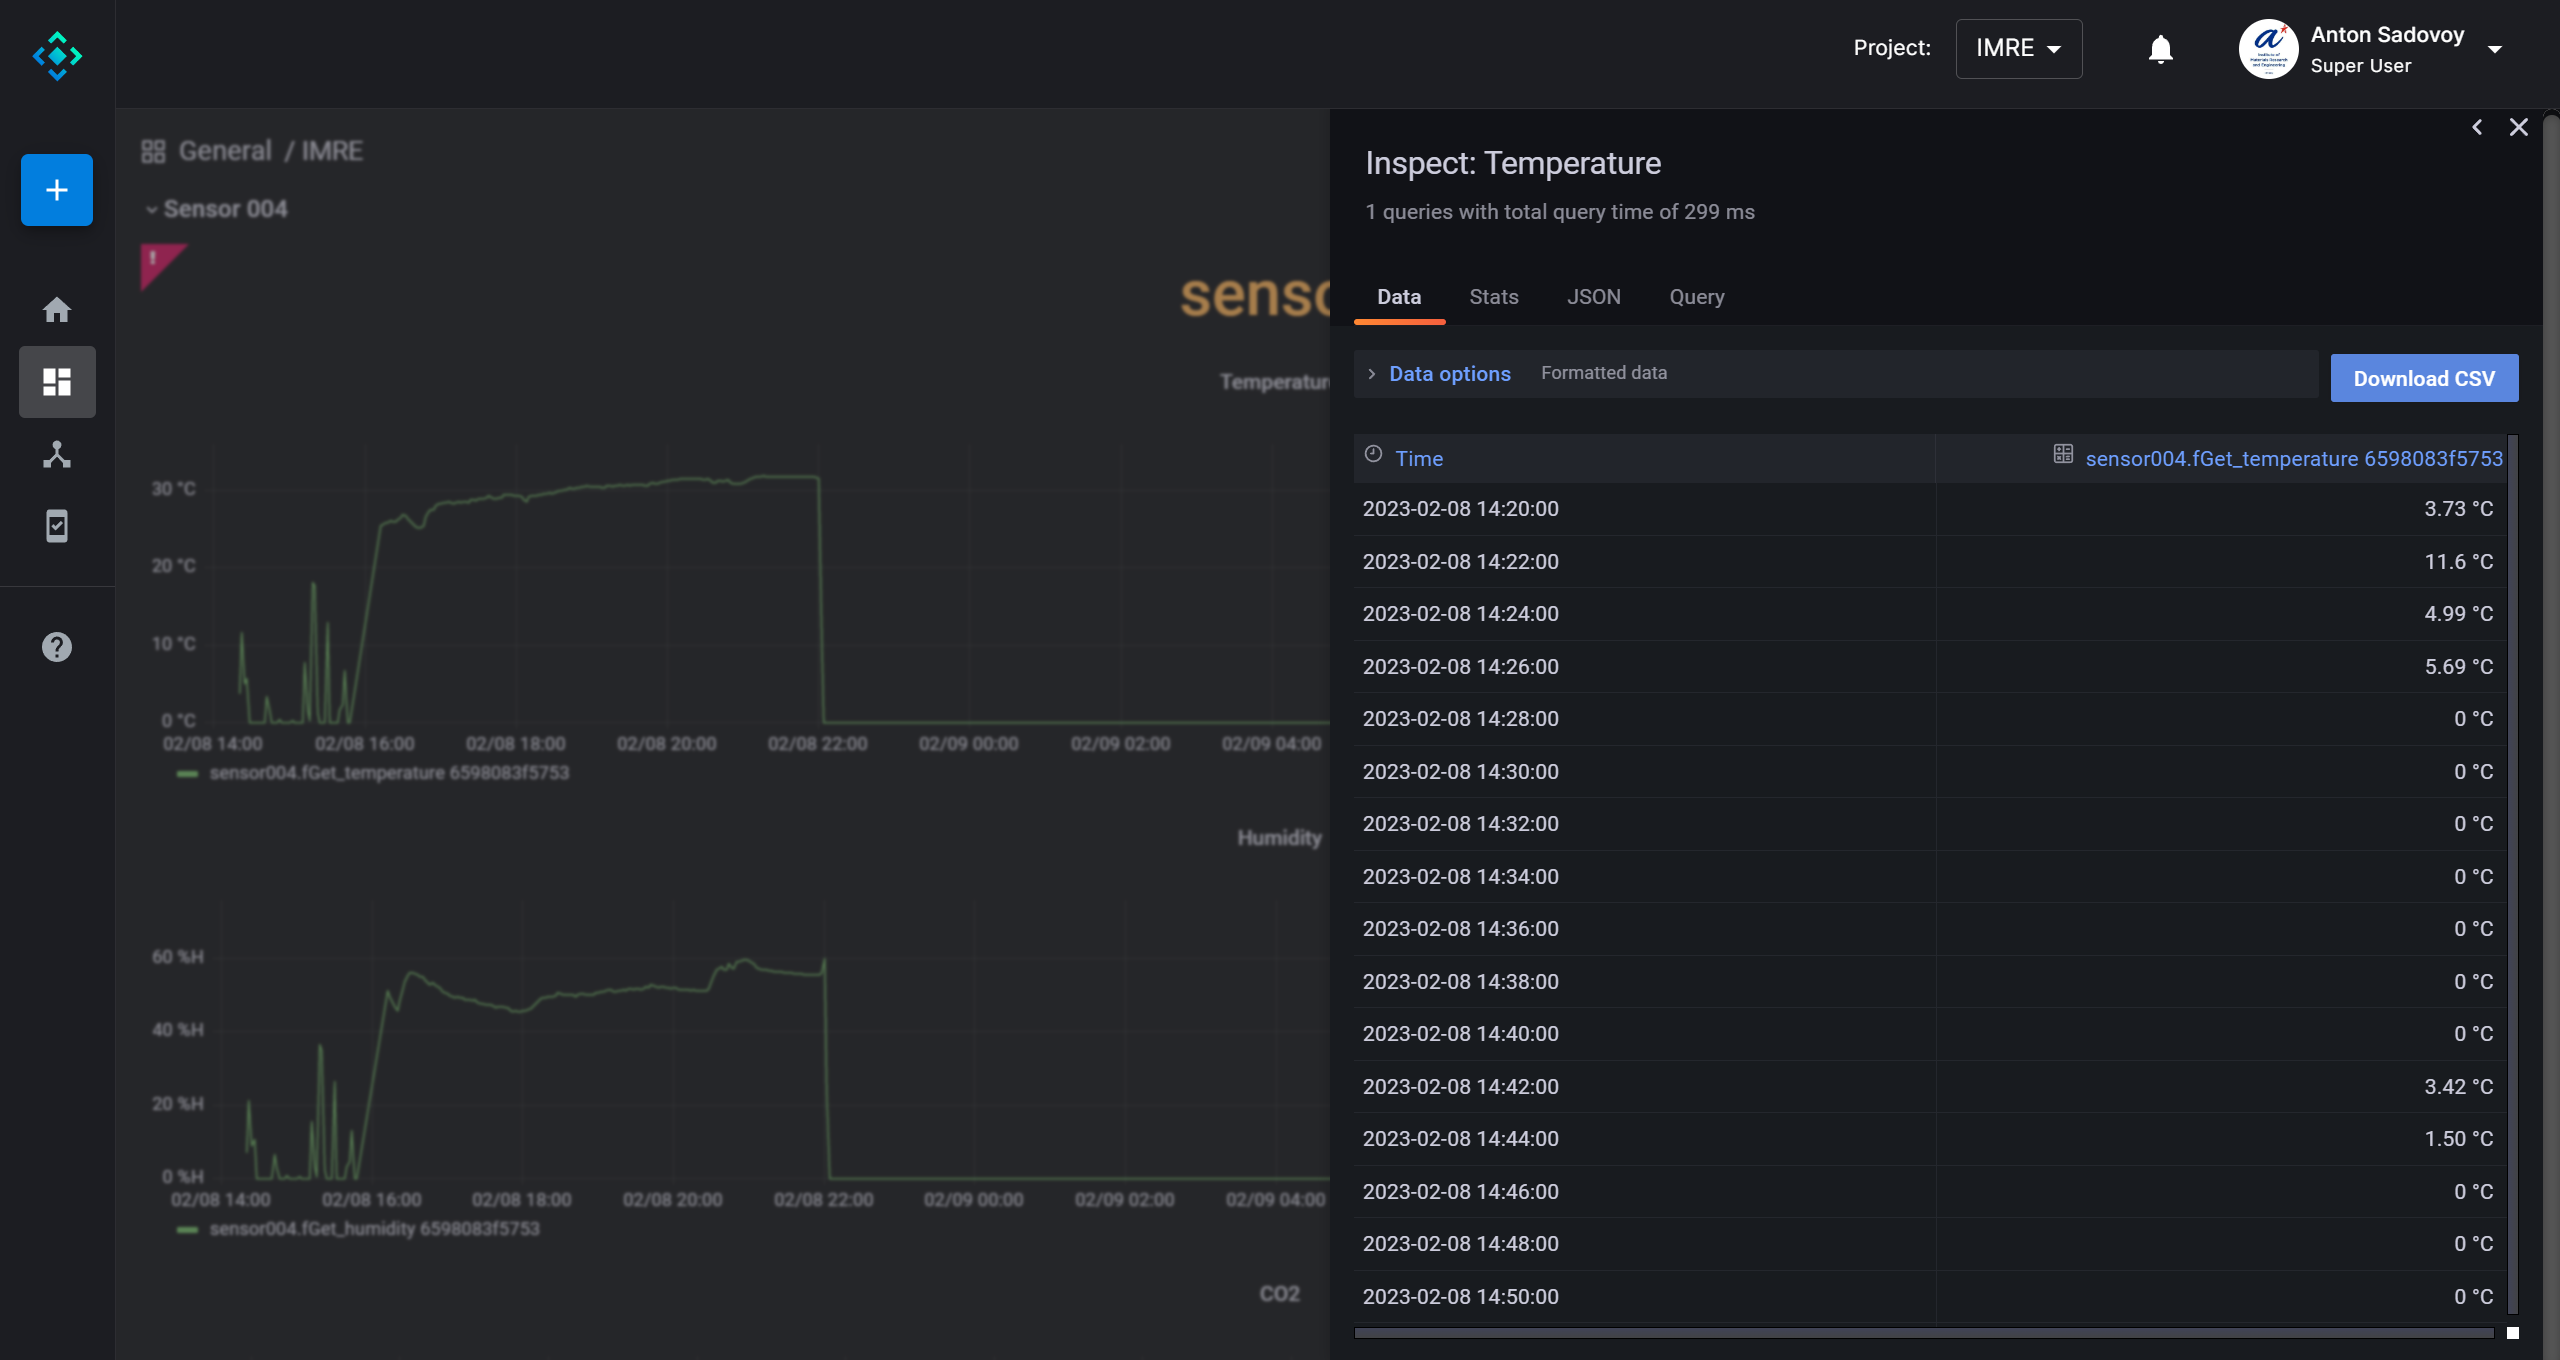
Dashboard - Data Inspect
- Analyze the Data: Once the user has downloaded the CSV file, they can open it using a spreadsheet program like Microsoft Excel or Google Sheets. From there, the user can analyze the data separately, create charts and graphs, or perform other relevant actions.
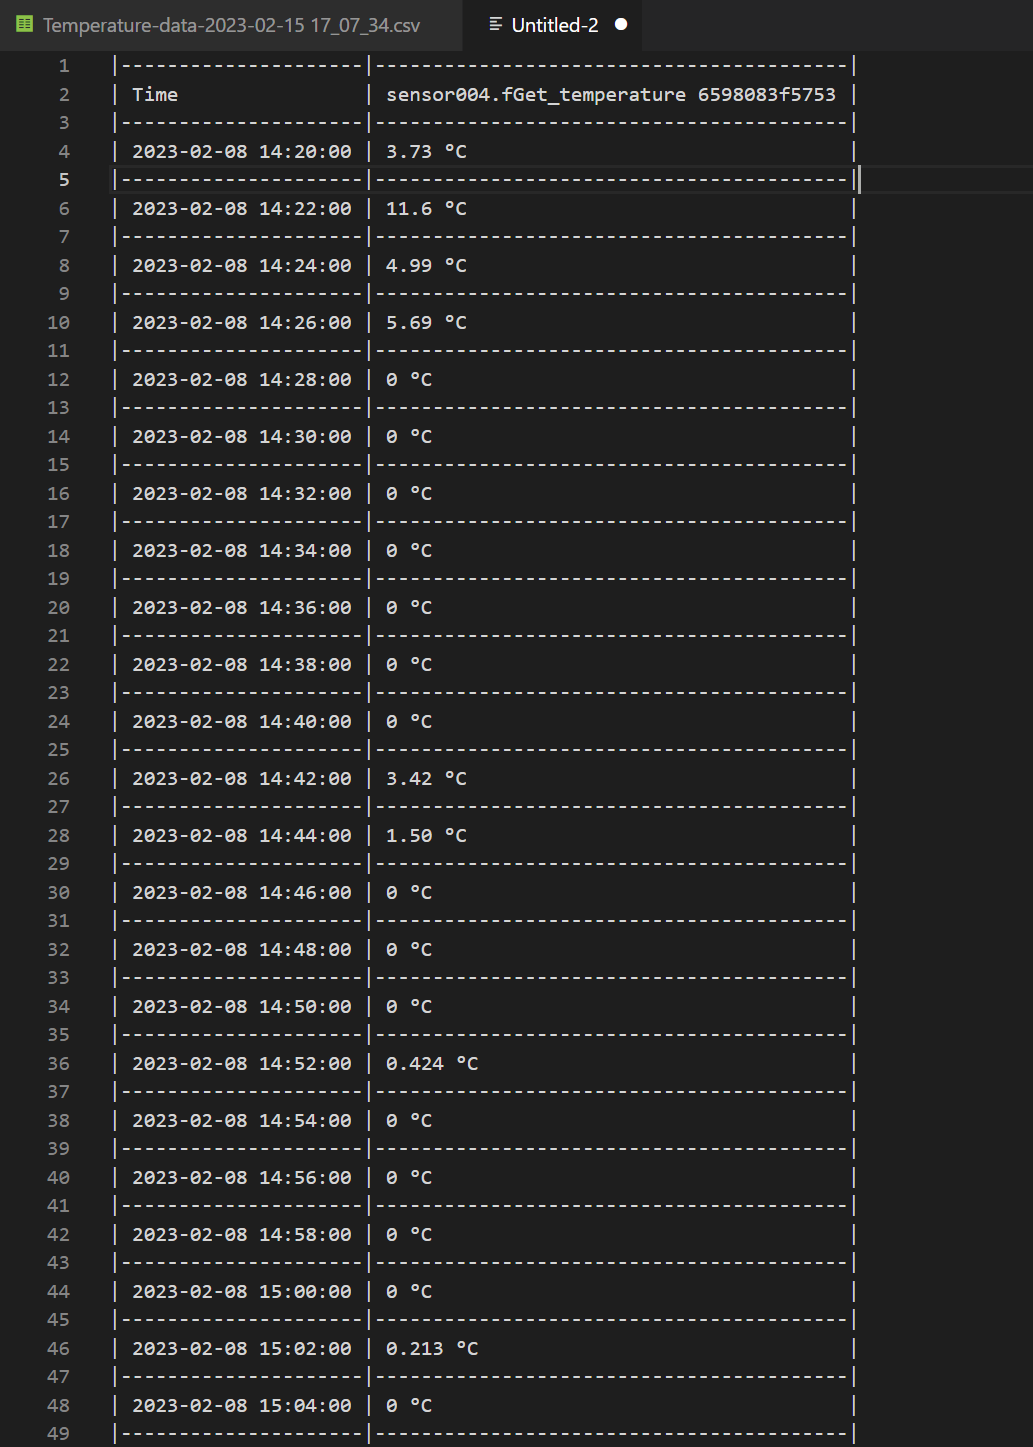
CSV data - downloaded
If there is a need for a dedicated APIs to extract the data directly, feel free to approach us at [email protected]
Updated about 1 year ago