
ABC + XYZ Analysis
There are specific requisites to visualize the ABC + XYZ analysis.
- Sufficient Data. Both Inventory and Orders
- Estimated data orders below 1000 will not work as expected.
The following are the steps to obtain the ABC/XYZ analysis.
-
Upload Data: To find the ABC analysis in the Syncware platform, the user needs to upload the relevant inventory and order sales data. This can typically be done by navigating to the "Warehouse Inventory" section of the platform and selecting the "Upload Data" option.
-
Access the Dashboard Tab: Once the data has been uploaded, the user can find the ABC analysis by accessing the "Dashboard" tab at the right side menu of the platform. The "Dashboard" tab allows users to access a range of data visualizations and insights related to their inventory and order sales data.
-
Locate ABC Analysis: Within the "Dashboard" tab, the user should look for the ABC analysis. This analysis is typically represented by a visual chart or graph that breaks down inventory items into three categories based on their importance: A-items, B-items, and C-items. The value of the inventory and the frequency of sales determine these categories. Some graphs represent the behavior of the products in accordance to the threshold defined for the ABC analysis.
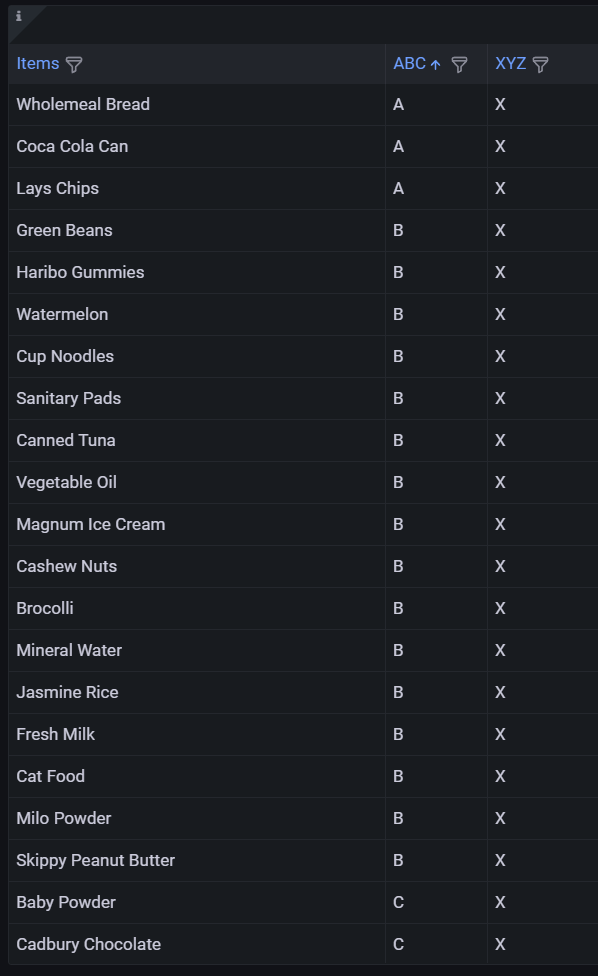
ABC/XYZ table
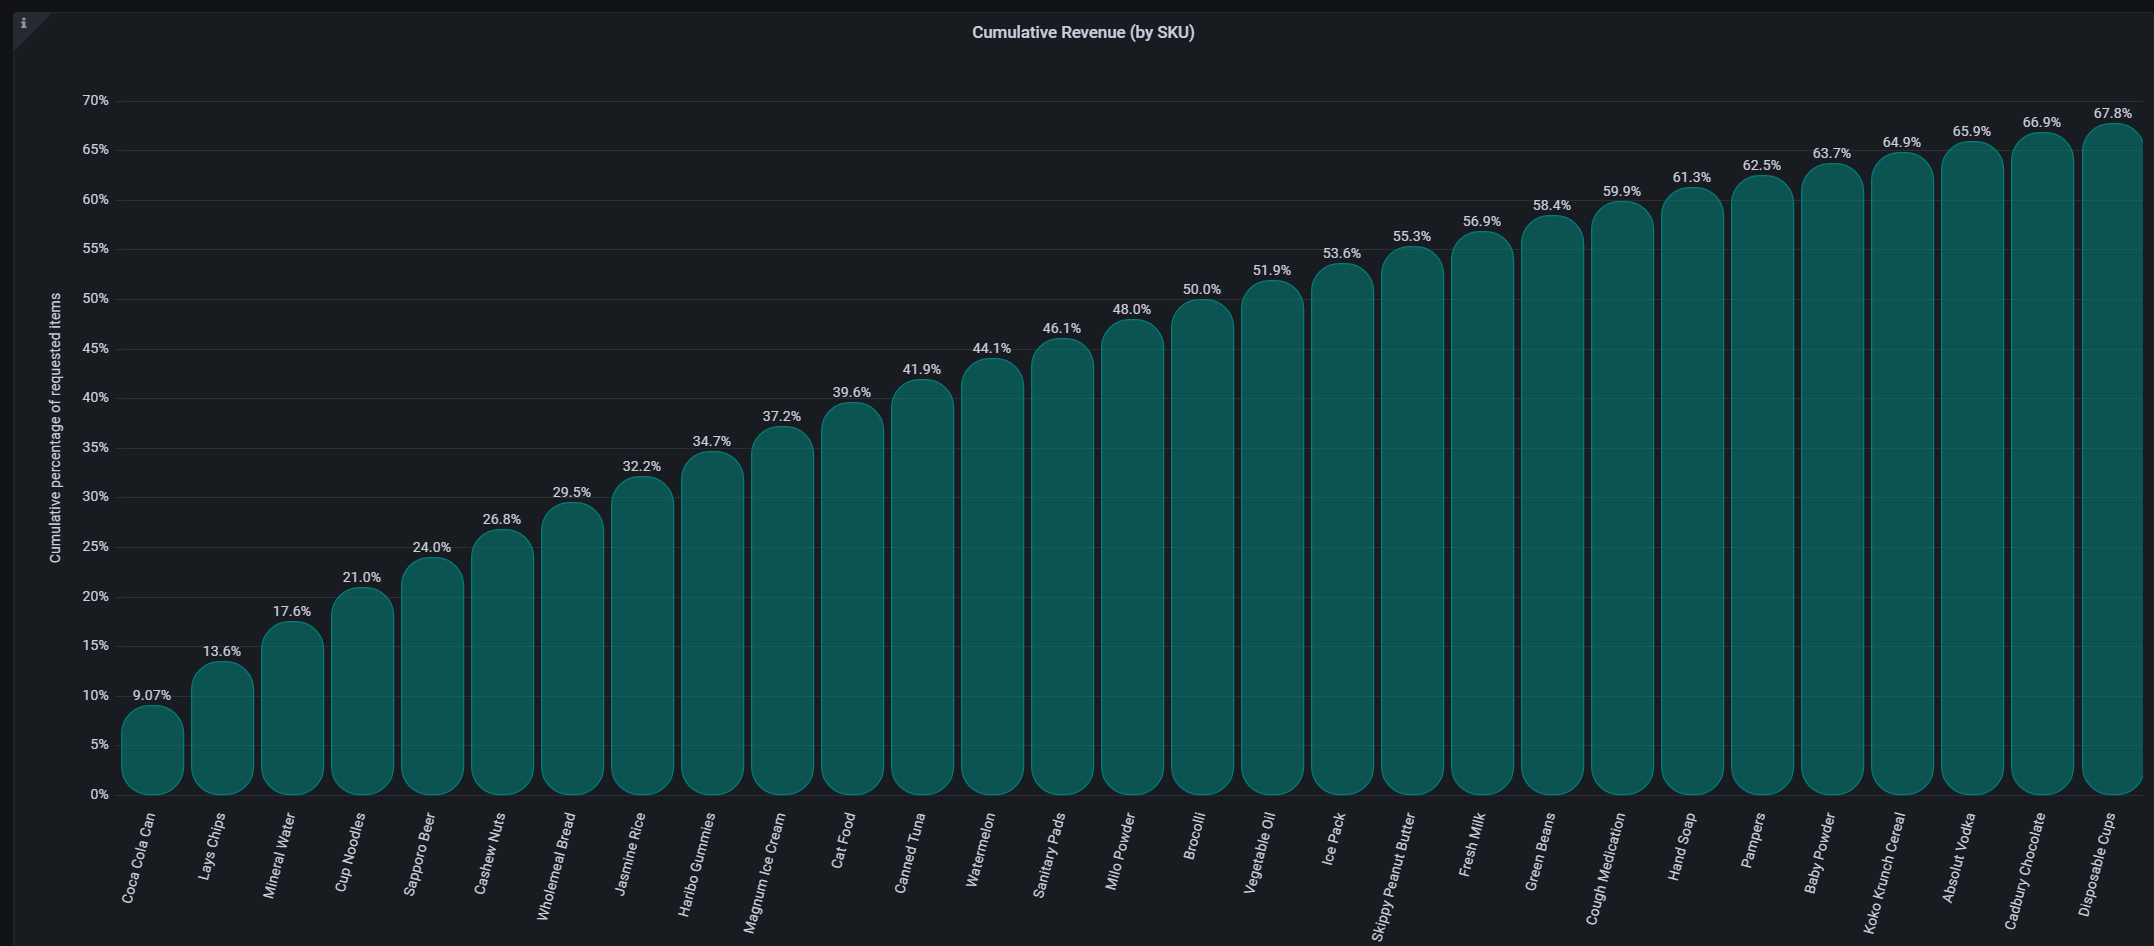
ABC analysis - SKU distributed by revenue
- View Results in Floor Plan Tab: In addition to the "Dashboard" tab, the user can also view the results of the ABC analysis in the "Floor Plan" tab. This tab allows the user to see a visual representation (3D model) of their inventory and sales data on a floor plan, which can help them identify trends and optimization opportunities.
More information about the power of the ABC analysis can be found in our blogs.
Updated about 1 year ago